
Checking if a specific website or web application is alive and well is a classic task of monitoring software. I monitor personal web services with good old Icinga2. Last year I wrote a small Python script that runs on a Icinga2 master or satellite node that queries the Traefik API to automate the generation of Icinga2 rules. For me this was a nice and useful exercise to learn how to use REST APIs together with Python for system administration. In the process of upgrading Traefik 1.7 to 2.0 I also had to modify this script.
So without further ado lets jump right in. The way my script works:
It fetches the exposed Traefik Routers with their coresponding hostnames and services and creates Icinga2 apply rules that use the HTTP check. The script is designed to run as a nightly cronjob so that new services that should be monitored are added automatically.
Requirements
- A working Traefik v2.x reverse proxy with it's API exposed
- Icinga2 monitoring server
Before proceeding please make shure you can access Traefik's API. For example in this way:
curl -s --user admin:passw0rd http://example.lan:8080/api/http/routers | jq
[
  {
    "entryPoints": [
      "dashboard"
    ],
    "middlewares": [
      "dashboard-auth@file"
    ],
    ...
Installation
Run all this steps on a Icinga 2 master or satellite node.
Download script and install script
git clone https://github.com/movd/traefik_icinga_check
sudo -u nagios mkdir /etc/icinga2/cronjobs
chmod +x traefik_icinga_check/traefik2_to_icinga.py
sudo cp traefik_icinga_check/traefik2_to_icinga.py  /etc/icinga2/cronjobs/
sudo chown nagios:nagios /etc/icinga2/cronjobs/traefik2_to_icinga.py
Set up parameters via .env
$ sudo -u nagios touch /etc/icinga2/cronjobs/.env
Open and insert parameters /etc/icinga2/cronjobs/.env (same as Traefik dashboard)
TRAEFIK_API_HOSTNAME='example.lan:8000'
TRAEFIK_USERNAME='admin'
TRAEFIK_PASSWORD='passw0rd'
Test the script manually by printing to STDOUT
$ sudo -u nagios /etc/icinga2/cronjobs/traefik2_to_icinga.py
apply Service "example.com https apache-apache" {
                import "generic-service"
                check_command = "http"
                vars.http_address = "example.com"
                vars.http_vhost = "example.com"

                vars.http_ssl = "1"
                vars.http_sni = "true"

                vars.notification["mail"] = {
                    groups = [ "icingaadmins" ]
                }
...
Configure the Host that runs Traefik
Edit your Traefik host and add the vars.services array, so that it matches the rules set in traefik2_to_icinga.py
object Host "Reverse Proxy" {
  import "generic-host"
  address = "10.0.0.254"
  vars.os = "Linux"
  vars.services = ["traefik"]
}
Create cronjob for nagios user
sudo -u nagios crontab -e
Edit and insert nightly cronjob. Something like that should suffice.
# Daily at 2am: Generate Icinga checks from Traefik API and restart Icinga2 service
0 2 * * * /etc/icinga2/cronjobs/traefik2_to_icinga.py > /etc/icinga2/zones.d/YOUR-ZONE/traefik_services.conf && systemctl restart icinga2 >/dev/null 2>&1
Note: Of course you need to print the output of traefik2_to_icinga.py to a directory that is either inside your zone or in conf.d
The end result should look like this:
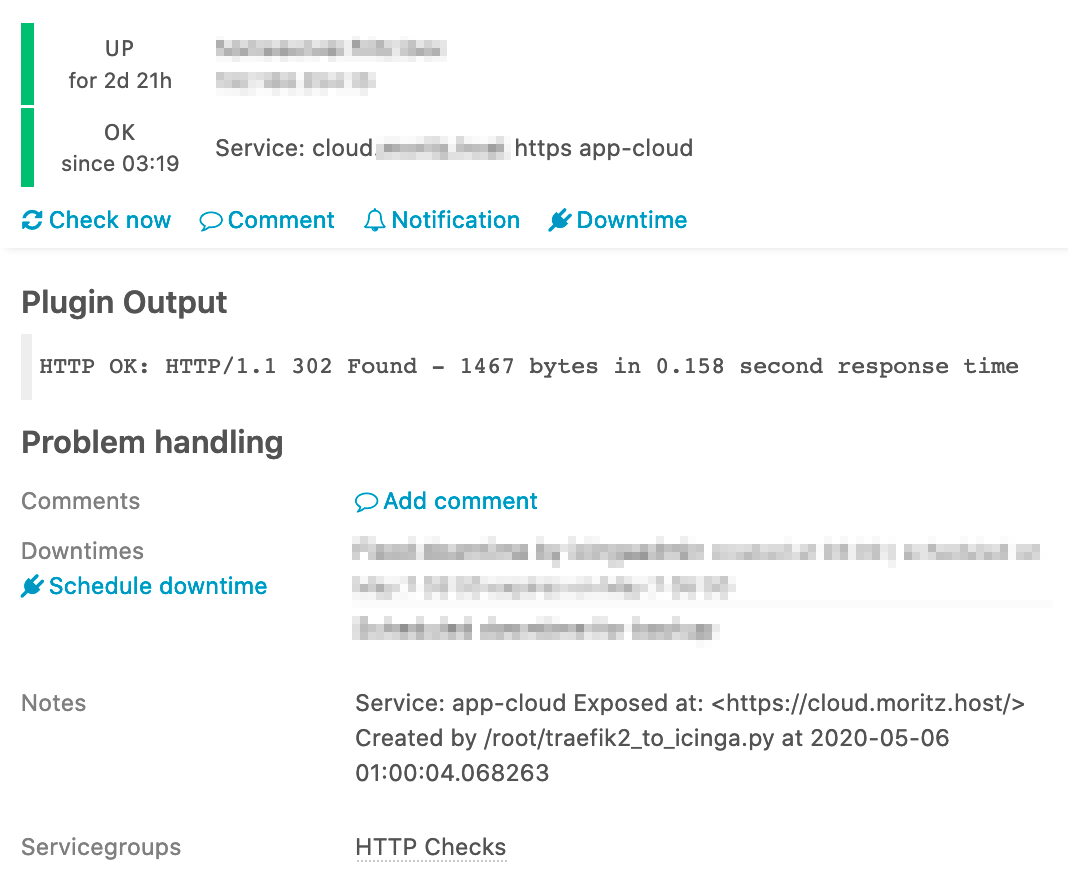
I am looking forward to any feedback or even pull-requests for the small script.
Source for the graphics used in the header: Background vector created by vectorpouch - www.freepik.com